ping answers only whether something is reachable. The next question is always "so where does it break?", and the tool everyone reaches for is traceroute on Linux and macOS, or tracert on Windows.
It is a tool people run every day and misread more than any other — seeing stars and concluding packets are lost, seeing a slow middle hop and blaming that router, and believing the list it prints is the path their packets took.
All three are wrong, and this page is about why.
If TTL and ICMP are new to you, read ping — the forty-year-old command still typed every day first. It will make this much easier, because traceroute is built on exactly the same machinery.
If you have never typed it before, start here
On Linux or macOS:
traceroute 8.8.8.8On Windows:
tracert 8.8.8.8What you get on the Unix side:
traceroute to 8.8.8.8 (8.8.8.8), 64 hops max, 40 byte packets
 1  192.168.1.1 (192.168.1.1)  1.234 ms  1.101 ms  1.087 ms
 2  10.4.0.1 (10.4.0.1)  8.412 ms  8.339 ms  8.502 ms
 3  * * *
 4  203.0.113.9 (203.0.113.9)  12.004 ms  11.887 ms  12.113 ms
 5  8.8.8.8 (8.8.8.8)  12.331 ms  12.209 ms  12.288 ms
Each line is one device somewhere along the way, ordered from nearest to furthest. The three numbers are the round trips of three probes, and line 3 with its three stars is a hop that did not answer — which does not mean anything is broken. More on that below.
December 1988, at Lawrence Berkeley Laboratory
It was written by Van Jacobson, the same name behind the TCP congestion control algorithms that kept the internet from collapsing in the late eighties. He was at Lawrence Berkeley Laboratory at the time, which is why the program is still called LBL traceroute.
The header of the original source carries a line reading:
-- Van Jacobson ([email protected]) Tue Dec 20 03:50:13 PST 1988And another sentence direct enough to be worth remembering:
I stole the idea for this program from Steve Deering. Since the first release, I've learned that had I attended the right IETF working group meetings, I also could have stolen it from Guy Almes or Matt Mathis.
The manual still carries the attribution today — open man traceroute on the machine you are sitting at and look at the AUTHOR section: "Implemented by Van Jacobson from a suggestion by Steve Deering."
The design thinking — why it was built this way
This section is what makes the output shape make sense, and what explains how the tool can lie.
1. Invent nothing; use a side effect of what already exists
traceroute asks no router anywhere for cooperation.
It relies on two rules every router already has to follow: decrement TTL by one on every forward, and when TTL reaches zero, discard the packet and send an ICMP Time Exceeded back to the sender. Those rules exist to stop packets circling forever. They were not put there so anyone could map a path.
traceroute simply sets TTL deliberately too low and collects the complaints. The address of whoever complained, round after round, becomes the path.
That is why it works against anybody's routers, including hardware built thirty years after 1988.
2. Why the port number increases on every probe
This is the heart of the design, and the answer to "how does it know which probe a complaint belongs to?"
The problem is that an ICMP error message brings back very little of the original packet. The standard has it carry the dead packet's IP header plus only 8 bytes of whatever followed.
For UDP those 8 bytes are exactly the whole UDP header — source port, destination port, length and checksum. There is no room left for a sequence number of your own.
So Van Jacobson used what was already there as the identifier: the destination port number, incremented by one before each probe. Every complaint therefore carries that port back with it, and can be matched to the probe that caused it.
Compare ping, which has Identifier and Sequence Number fields available directly. traceroute has no such thing, and had to borrow a field designed for something else.
3. Why it aims at high ports nobody is listening on
The default base is port 33434, counting upward. The reason is that traceroute wants no service listening on that port at the destination.
With nothing listening, the destination replies ICMP Port Unreachable — a different message from the Time Exceeded that middle routers send. That difference is the signal meaning "you have arrived, stop."
Hit a port that does have a service listening and the destination says nothing at all, so traceroute keeps raising TTL to its ceiling without ever knowing it got there.
The original source does not explain the choice of 33434 specifically. The often-repeated story is 32768 plus 666, but it appears in neither the code nor the manual, so treat it as unverified folklore.
4. Three probes per hop
The default is three, because UDP guarantees nothing. One loss is ordinary and should not turn the whole line into blankness.
And seeing three values at once shows the variation rather than just a middle value. Three widely separated numbers say more than one good-looking one.
5. Report what came back; do not conclude for you
Exactly like ping. traceroute never says "the problem is at hop 7". It prints what it sent, who answered, how long it took, and where nothing answered. Interpretation is the human's job.
Which is just as well, because as the rest of this page shows, misinterpreting it is very easy.
How it works
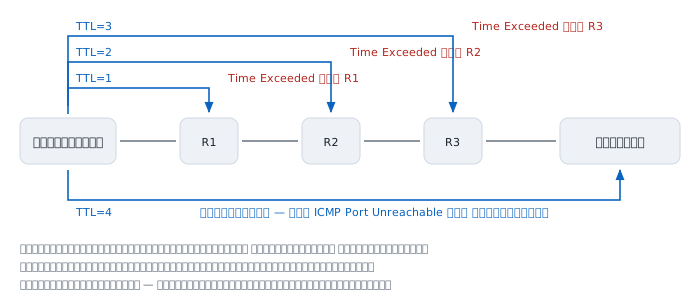
In order:
- Send a packet with TTL set to 1 → the first router decrements it to 0 → discards it and returns Time Exceeded → you have the name of hop 1
- Send again with TTL 2 → the first router decrements to 1 and forwards, the second decrements to 0 → you have hop 2
- Repeat
- Until TTL is large enough to reach the destination, which answers Port Unreachable instead of Time Exceeded → you know it is finished
Notice that no packet ever travels the whole path and reports what it saw. Every line comes from a different packet, a different journey, and a different moment in time. That fact is the root of everything that can go wrong below.
Why an ICMP error only brings back 8 bytes
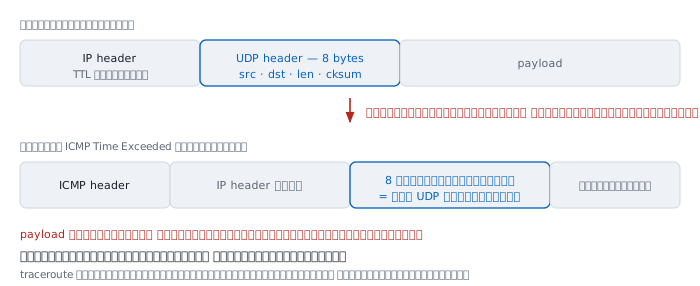
Those eight bytes are all traceroute has to work out whose complaint this is, and the reason the design had to borrow the port number for the job.
Reading the output
 4  203.0.113.9 (203.0.113.9)  12.004 ms  11.887 ms  12.113 ms
 |  |                          |
 |  |                          +-- the three probes' round trips
 |  +-- who answered, name and address
 +-- the TTL used for that round, not a fixed position on the path
The commonest misreading is treating the leading number as a fixed position of a device on the route. It is the TTL used in that round, which is not the same thing once the path changes during the measurement.
A star is one symbol with four meanings
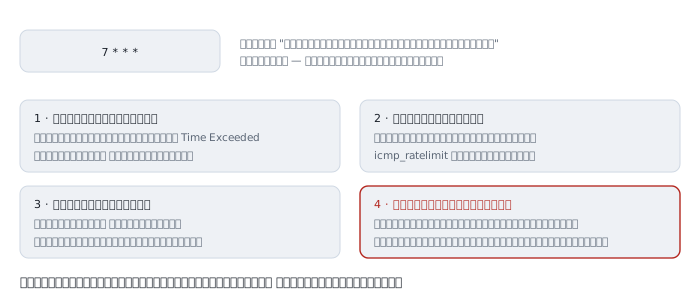
* means only "nothing came back within the wait". There are at least four causes, and three of them are not problems.
- That router is configured not to emit ICMP Time Exceeded, which is extremely common in provider networks
- The router rate limits its own ICMP, so it answers sometimes and not others
- The reply was genuinely sent but was lost on the return path
- A firewall in the middle dropped the outbound probe, because it is UDP to an odd port
The reading rule: stars in the middle with the next hop answering normally are almost never a problem. Stars that begin at one hop and never come back for the rest of the trace are the interesting ones.
The letters after the time
A letter after a time means traceroute got a different kind of ICMP error back, not an ordinary Time Exceeded.
  !H   host unreachable          cannot reach that host
  !N   network unreachable       cannot reach that network
  !P   protocol unreachable      it does not speak this protocol
  !F   fragmentation needed      too big with DF set; shows MTU
  !S   source route failed
  !U   !W  destination network/host unknown
  !I   source host is isolated
  !A   communication with that network administratively prohibited
  !X   !Z  communication prohibited generally / with that host
  !    the TTL of the reply came back as 1 or less
!A and !Z are unusually clear in practice — they mean somebody deliberately blocked it, not that something is broken. !F is a direct clue about an MTU problem, described in the ping article.
Three variants that send completely different things
This is why two people tracing the same destination get different results.
  Linux, macOS, BSD    UDP to high ports        the default
  Windows  tracert     ICMP Echo                the default
  traceroute -I        ICMP Echo                same as Windows
  traceroute -T        TCP SYN                  best through firewalls
  traceroute -P proto  pick one: UDP TCP GRE ICMP
The difference matters enormously wherever there is a firewall.
- Somewhere blocking UDP to odd ports → ordinary
tracerouteshows nothing but stars, while Windowstracertworks fine - Somewhere blocking inbound ICMP →
tracertis blind, while UDP may pass - Somewhere allowing only 443 → only
traceroute -T -p 443will see anything
If traceroute shows nothing, do not conclude the path is broken. Change protocol and try again first, because all you have actually proved is that one protocol did not get through.
The manual adds a warning worth knowing: with any protocol other than UDP, the last hop often appears to be missing, because the destination sends no Port Unreachable and there is no signal that you arrived.
When traceroute lies
1. The list may not be any packet's path
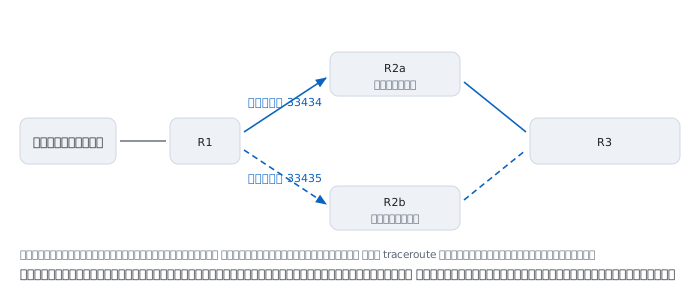
This is the most serious item and the least widely known.
Modern networks spread load across several paths, choosing based on a value computed from the packet header — source and destination address, protocol, and port numbers.
But classic traceroute changes the destination port on every probe, because that is the only way it can identify each one. So each probe gets assigned to a different path.
The printed list is therefore several routes stitched together. That route may never have been travelled by any packet, not even once.
The problem was set out properly in a 2006 paper, Avoiding traceroute anomalies with Paris traceroute, and the fix is Paris traceroute, which holds the load-balancing inputs constant and uses a different field as its identifier.
If a path looks unstable between runs, suspect this before anything else.
2. A slow middle hop does not mean a slow path
The same point as in the ping article, and it matters more here, because you can see every hop's numbers at once and are therefore tempted to compare them.
Answering a Time Exceeded is work for the router's CPU, not its forwarding hardware, and it is the lowest priority work there is.
Read the time at the final destination, and believe only numbers that go up and stay up. If hop 5 shows 300 ms while hops 6 through 12 show 40 ms, hop 5 is merely slow to answer, not slow to forward.
3. You see the forward path only, never the return
traceroute measures round trips but shows only the addresses on the way out. The return path may be completely different, and you cannot see it.
So a jump in time between two hops may come from a changed return path rather than from the link between those two hops. Seeing the return path requires a tool at the other end.
4. MPLS makes whole stretches disappear
In provider networks using MPLS, a packet may cross several routers where the middle ones neither decrement TTL nor answer at all.
The result is two hops that look adjacent with a large time gap between them, when in fact several devices sit in between. Not a fault in the tool — a structure deliberately hidden.
5. The names and AS numbers may not be true
Names come from reverse DNS, which network owners set themselves and often leave untouched for years. A name saying Singapore may be a box that moved to Tokyo long ago.
As for the AS numbers from -A, the program's own manual warns they may be inaccurate, because the database being queried and the actual state of the internet do not always agree.
Worked examples from real work
Case 1 — stars everywhere while the network is fine
$ traceroute api.partner.example
 1  192.168.1.1  1.1 ms  1.0 ms  1.1 ms
 2  * * *
 3  * * *
 4  * * *
...
30  * * *
How to read it. It means nothing yet. Change protocol first.
$ traceroute -I api.partner.example
 1  192.168.1.1  1.1 ms  1.0 ms  1.1 ms
 2  10.4.0.1  8.4 ms  8.3 ms  8.5 ms
 3  203.0.113.9  12.0 ms  11.9 ms  12.1 ms
 4  api.partner.example  13.2 ms  13.0 ms  13.1 ms
A perfectly ordinary path. What happened is that a firewall drops UDP to high ports, which is the default posture of a great many corporate firewalls.
Not yet proved. We know ICMP passes and UDP does not. We do not know which firewall drops it, and we have not shown that the application's real traffic — presumably TCP 443 — gets through. That needs -T -p 443.
Case 2 — a middle hop that looks bad and is not
$ traceroute 8.8.8.8
 1  192.168.1.1        1.2 ms    1.1 ms    1.1 ms
 2  10.4.0.1           8.4 ms    8.3 ms    8.5 ms
 3  203.0.113.1      284.1 ms  291.7 ms  288.3 ms
 4  203.0.113.9       12.0 ms   11.9 ms   12.1 ms
 5  8.8.8.8           12.3 ms   12.2 ms   12.3 ms
How to read it. Hop 3 shows nearly 300 ms, yet hops 4 and 5, which are behind it, show 12 ms. If hop 3 genuinely added delay, everything after it would inherit that delay, because everything must pass through it.
The time did not go up and stay up. Hop 3 is only slow to answer.
Not yet proved. Hop 3 may still have a genuine problem with some kind of traffic that traceroute does not resemble. This clears it only of the specific charge of delaying everything passing through.
Case 3 — a path that does not exist
$ traceroute example.net
 5  ae-1.r01.bkk.example-isp.net   24.1 ms
    ae-3.r02.sin.example-isp.net   41.8 ms
    ae-1.r01.bkk.example-isp.net   24.3 ms
 6  ae-2.r04.hkg.example-isp.net   58.2 ms  57.9 ms  58.4 ms
How to read it. Hop 5 answered from two addresses in different cities, alternating across the three probes. That is not an error; it is per-flow load balancing at work, and because traceroute changes the destination port on every probe, each probe was assigned to a different path.
Line 6 is the trap — there is no way to know which of the two paths in line 5 it belongs to. Joining 5 and 6 into one route may describe a route that does not exist.
Confirm with Paris traceroute, which holds the load-balancing inputs fixed.
Not yet proved. We do not know how many real paths there are, nor which one the application's traffic uses — which will be a single stable path, since a real flow keeps a fixed port.
Case 4 — is the problem inside or outside the organisation
$ traceroute -T -p 443 app.vendor.example
 1  192.168.1.1          1.1 ms   1.0 ms   1.1 ms
 2  10.4.0.1             8.4 ms   8.3 ms   8.5 ms
 3  10.4.255.1           9.1 ms   9.0 ms   9.2 ms      <- the edge
 4  203.0.113.1         12.4 ms  12.2 ms  12.5 ms
 5  * * *
 6  * * *
 7  * * *
How to read it. Traffic leaves the organisation, crosses the edge router and reaches the provider before it stops. The problem is not inside. That is enough to hand the case to the provider, along with the address of the last hop that answered.
-T -p 443 is used because it matches the application's real traffic, rather than a random UDP port nobody bothers to permit.
Not yet proved. The stars after hop 4 may be a policy of not answering rather than a break. Test that the destination is actually reachable with another tool before saying the path is down.
Case 5 — use mtr when the symptom comes and goes
traceroute runs once and stops, so intermittent problems escape it.
$ mtr -rwc 200 8.8.8.8
HOST                        Loss%   Snt   Last   Avg  Best  Wrst StDev
  1. 192.168.1.1             0.0%   200    1.1   1.2   1.0   3.2   0.2
  2. 10.4.0.1                0.0%   200    8.4   8.5   8.2  12.1   0.4
  3. 203.0.113.1            42.0%   200   12.1  12.3  11.8  19.0   0.6
  4. 203.0.113.9             0.0%   200   12.0  12.1  11.9  14.2   0.3
  5. 8.8.8.8                 0.0%   200   12.3  12.4  12.1  15.0   0.3
How to read it. Hop 3 shows 42% loss while hops 4 and 5 behind it show 0%. If hop 3 really lost packets, everything after it would lose them too.
This is the rule to memorise — loss at a middle hop means something only if it also appears at the hops after it. If it does not, that is the router rate limiting its own replies.
Not yet proved. 0% at the destination proves ICMP got through intact. It does not prove the application's traffic is not being dropped.
Case 6 — when the first hops are not the routers you think
$ traceroute 8.8.8.8
 1  10.72.0.1  4.2 ms  4.1 ms  4.3 ms
 2  100.64.12.1  9.8 ms  9.7 ms  9.9 ms
 3  203.0.113.1  14.1 ms  13.9 ms  14.2 ms
How to read it. Hop 2 falls inside 100.64.0.0/10, the range reserved for providers' Carrier-Grade NAT. It is neither an ordinary private address nor a public one.
Seeing it means you are behind CGNAT, which explains a number of downstream symptoms, such as being unable to accept inbound connections.
Not yet proved. We do not know how many layers of NAT there are, and we have not shown that CGNAT is the cause of whatever is being chased.
Footnote: there is a standard traceroute, and nobody uses it
In 1993, RFC 1393 proposed a different way to trace routes, using an IP option and a new ICMP message type, which would return the whole path in n+1 packets instead of 2n.
It was never deployed at any scale.
What won was Van Jacobson's method, which asks nobody to implement anything new. The same lesson as ping: a tool that works with what already exists beats a better tool that has to wait for the whole world to upgrade.
When traceroute is no longer enough
- mtr — continuous tracing with per-hop statistics; catches intermittent faults. If you learn only one more tool, make it this one
- Paris traceroute — when load balancing is suspected
- traceroute -T -p 443 — when UDP and ICMP are both blocked
- A provider's BGP looking glass — shows the path from their side back to you, which is the return path your own traceroute can never see
- tcpdump or Wireshark — once you are done guessing
traceroute is an excellent tool for the question "where does it stop", and a poor one for the question "what is the path".
The difference between those two questions is what separates people who can use it from people who can type it.
References
Standards
- RFC 792 — Internet Control Message Protocol September 1981 — defines Time Exceeded (type 11), Destination Unreachable (type 3), and the rule that errors carry back 8 bytes of the original
- RFC 1812 — Requirements for IP Version 4 Routers the requirements on decrementing TTL and sending Time Exceeded
- RFC 1393 — Traceroute Using an IP Option January 1993 — the standard nobody uses
- RFC 1191 — Path MTU Discovery where the MTU shown beside !F comes from
- RFC 6598 — IANA-Reserved IPv4 Prefix for Shared Address Space the origin of the 100.64.0.0/10 range used for CGNAT
Original source and research
- Van Jacobson's original source — its header explains how the program works and contains the line about stealing the idea from Steve Deering
- Avoiding traceroute anomalies with Paris traceroute Augustin et al., IMC 2006 — the load-balancing problem and the fix
- paris-traceroute.net
Manuals
man tracerouteon the machine you are sitting at — the AUTHOR section has the provenance, and BUGS has the limitations worth reading before using any protocol other than UDPman mtr, andtracert /?on Windows